
What are data analytics? Learn that your data matters!
Elice
5/16/2023
While the amount of data being produced at large was only 0.16 ZB even until 2005, it has since grown to 64.2 ZB in 2020. It’s no exaggeration to say that data has ushered in a world-changing era. The era of digital transformation based on data has not only improved productivity and product quality but has also changed work culture as a whole.
Today, data analysis is not simply the organization of resulting data, but a powerful tool that can be used to understand customers through consumer behavior patterns. Data analysis has become the most important area of any business, and not just for the IT industry. Data is expected to become more important moving forward as more businesses prepare for and proceed with digital transformation.
As the importance of data becomes emphasized in our lives, knowing how to access and utilize it properly can become the key to rapid success. In line with this trend, today we’re going to learn what data analysis is and why it’s needed, and even examine successful cases of big data utilization.
What are data analytics?
Data analysis is the comprehensive process of collecting, organizing, manipulating, and analyzing data to discover useful insights, such as patterns and trends for a particular target. A variety of methods are used in this process, such as statistical analysis, machine learning, and data mining. The most important element of data analysis is the ‘data’ itself. Data is a set of specific facts or information. Because data analysis is based on data, how much quality data you can collect is paramount. The more data you have, the more accurate your data analysis is.
In the past, data was used to measure performance, but recently, it is also used to improve service development and recommendations, customer classification, and purchase predictions based on customer purchase and activity data. In addition, it is widely used for the digital transformation of enterprises, such as supply chain management and improvements to the manufacturing process. The insights derived from the data can greatly help an enterprise or organization develop. Data analysis can help foster correct decision making through predicting results from patterns.
Data analysis has a significant impact on individual decisions as well as those of a company or organization, and the imperative is to collect as much data as possible from all sectors to identify specific patterns and correlations, predict results, and find solutions.
Why Data Analysis Is Important
Data analytics is constantly emphasized in every field! But why exactly is data analytics essential to our real lives? Let’s take a step-by-step approach and examine the benefits and prospects of data analysis, as well as the reasons behind its importance.
Benefits of Data Analysis
Data analysis is about improving decision-making, increasing efficiency, and helping to reduce costs. It also helps you gain a better understanding of your customers and markets, and discover new opportunities. Data is therefore becoming increasingly important to business.
Informs you to make efficient decisions
The importance of data is emphasized throughout all of the planning process, from product development to sales to marketing. Enterprises can analyze data to derive insights and specify expected outcomes. Such predictions assist in making quick decisions, thereby enhancing the efficiency of decision-making.Improves target understanding and satisfaction
Data analysis is becoming more important in the marketing field. You can track data such as purchase history and preferences for a particular consumer group to gain insight into their purchasing patterns and preferences. This will empower you with the knowledge to better understand your customers. You can discover the customer’s needs faster and authenticate them through A/B tests, etc. This enables companies to improve customer loyalty and satisfaction by providing better products and services that meet the needs of their target customers.Help optimize marketing
You will be able to measure and analyze customer data to quantitatively evaluate marketing performance, and devise optimized marketing strategies that reflect ongoing feedback for the market and customers. You will also be able to reorient your established understanding of the target by analyzing the data given as a result. This will enable companies to consistently deliver optimized marketing that targets the right potential customers for a product or service.
In fact, the most common use cases of big data that end users are likely to encounter are related to these sorts of benefits of data analysis. Just as we analyze departure rates and views on SNS such as personal YouTube, Instagram, and blogs, companies continue to collect and analyze data to improve target understanding and optimize marketing.Improves work efficiency
Identify inefficiencies within the business and help optimize operations. Businesses can track and monitor key performance indicators (KPIs) such as sales figures, production costs, and satisfaction to identify areas that need to be improved upon more quickly. Data can also help you manage your business goals and performance more clearly. This is of great use for businesses that need to efficiently utilize their limited resources.Enhances business risk management by increasing predictability
You can get insights from data before you officially launch a product or service. This greatly helps to identify potential weaknesses and areas of improvement. The importance of data becomes increasingly emphasized as it allows enterprises to drive purchases and better serve customer needs. In addition, insights from historical data can help you predict and respond to the future. This helps your business proactively avoid potential risks.
Data Analysis Prospects in Korea
According to Korea’s IDC “2021-2025, Big Data and Analysis Market Forecast in Korea,” the domestic data analysis market will grow by 6.9 percentage points annually until 2025. Notably, the data visualization and analysis platform has grown dramatically. We are also keeping an eye on the expansion of how data analysis is being used. Not only data scientists, but marketing departments and business managers are also using data analysis for their work. 40.8% of large companies have even answered that more than 1,000 employees are already using data analytics for business insights. When you consider responses pertaining to whether they plan to implement data analytics within a year, it can be said that 70% of large companies are using or planning data analysis for their businesses. Therefore, the importance of data is expected to grow day by day in Korea.
Data Analysis Utilization Cases
So what are some of the real-life cases of big data usage? The examples of how data analytics are utilized below demonstrate that the proper analysis and utilization of given data can produce desirably effective results.
Big Data Use Case 1: Shinhan Card Data Product Sales
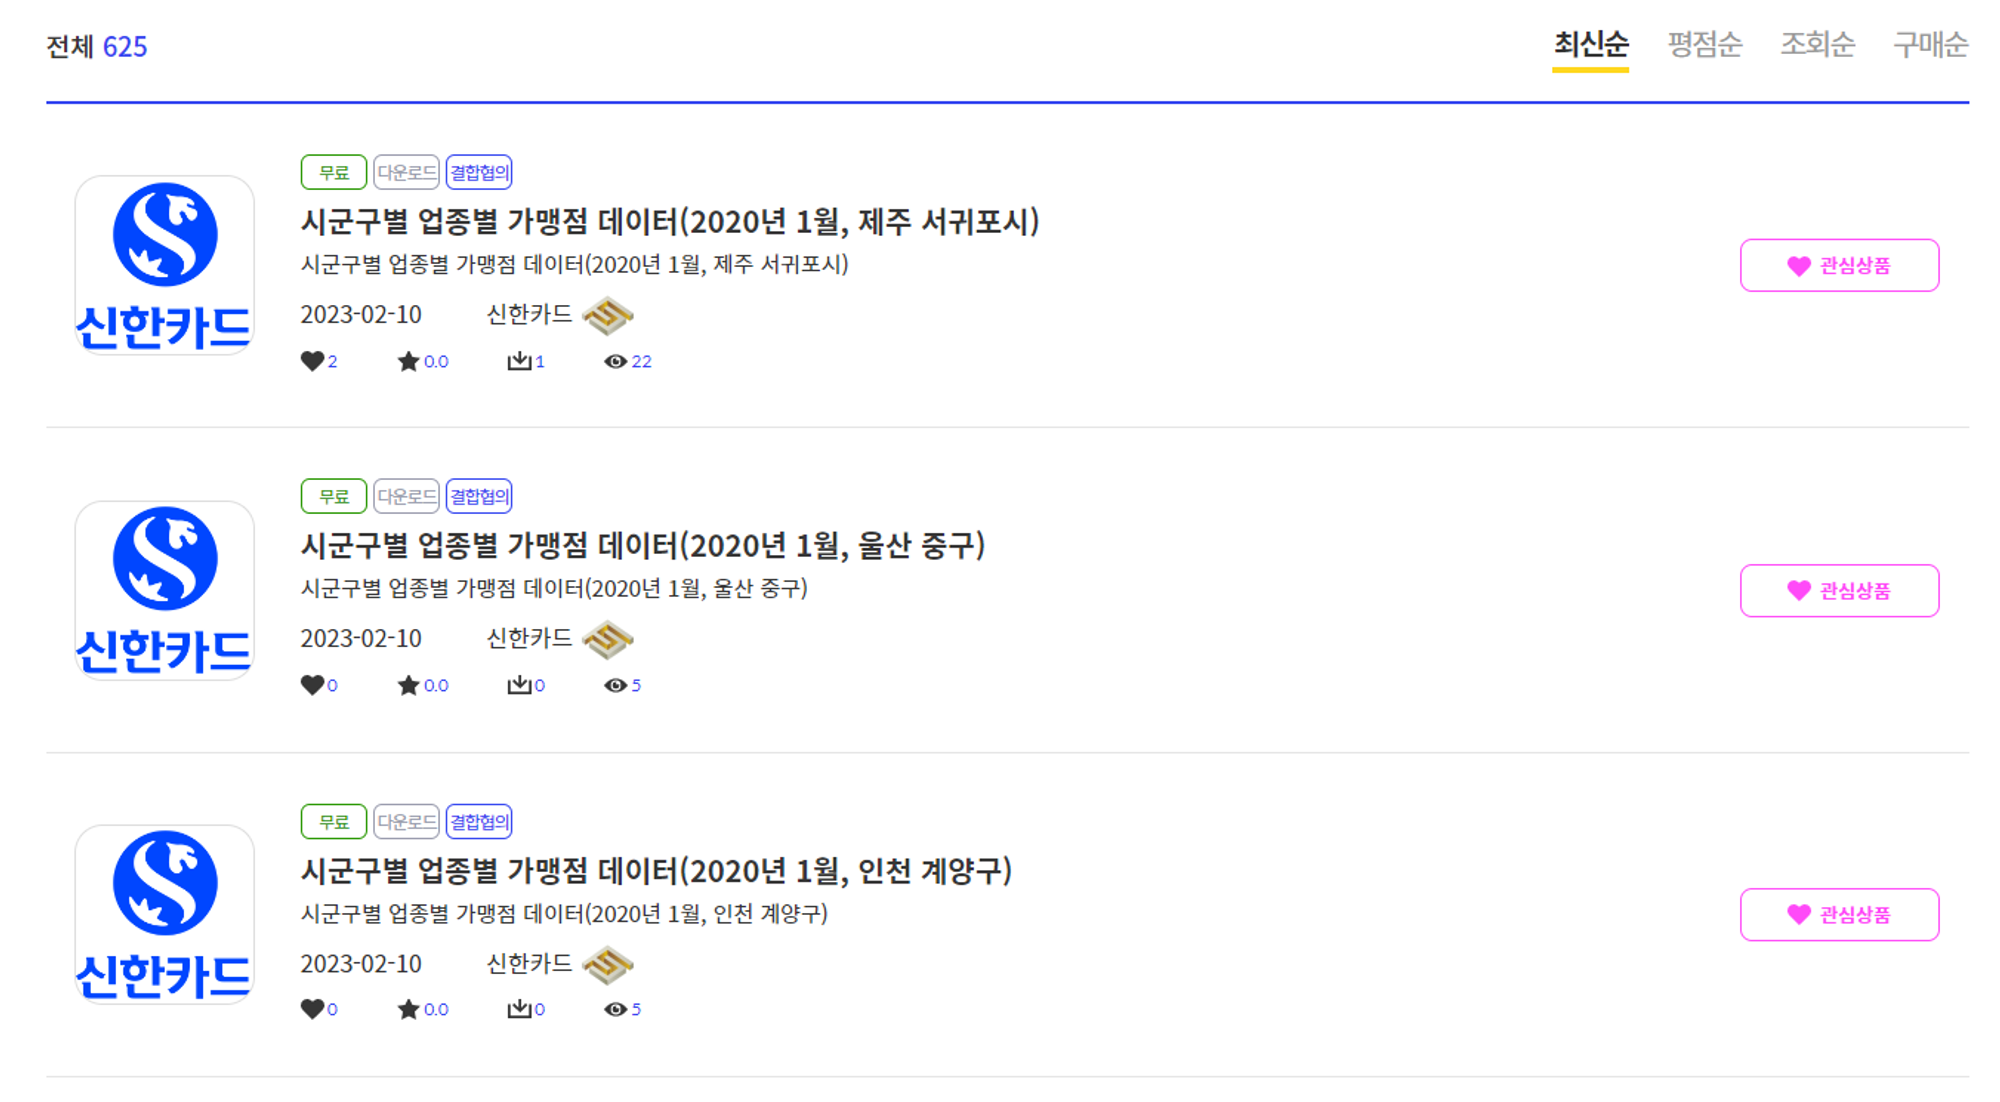
The first case of big data usage is the case of Shinhan Card’s data product sales. The card industry is currently trying to diversify its sources of profit through digital transformation. Shinhan Card was the first among these domestic credit card companies to succeed in monetizing data by exporting it to leading overseas companies and institutions. Officials analyzed that Shinhan Card’s actual domestic consumption data and data analysis capabilities accumulated over the past 10 years combined were what made this result possible.
Google purchased Shinhan Card’s domestic online payment data in July 2021. According to Shinhan Card’s announcement, data sales revenue, which was only 200 million won until 2014, rose vertically to 2 billion won in 2017 and 10 billion won in 2021. A Shinhan Card official revealed that “revenue will increase by 30-50% every year over the next three years.”
3 ESG Digital Transformation Success Stories - Learn now
Big Data Usage Case 2: Hyundai Motor Group’s Forecast on Big Data
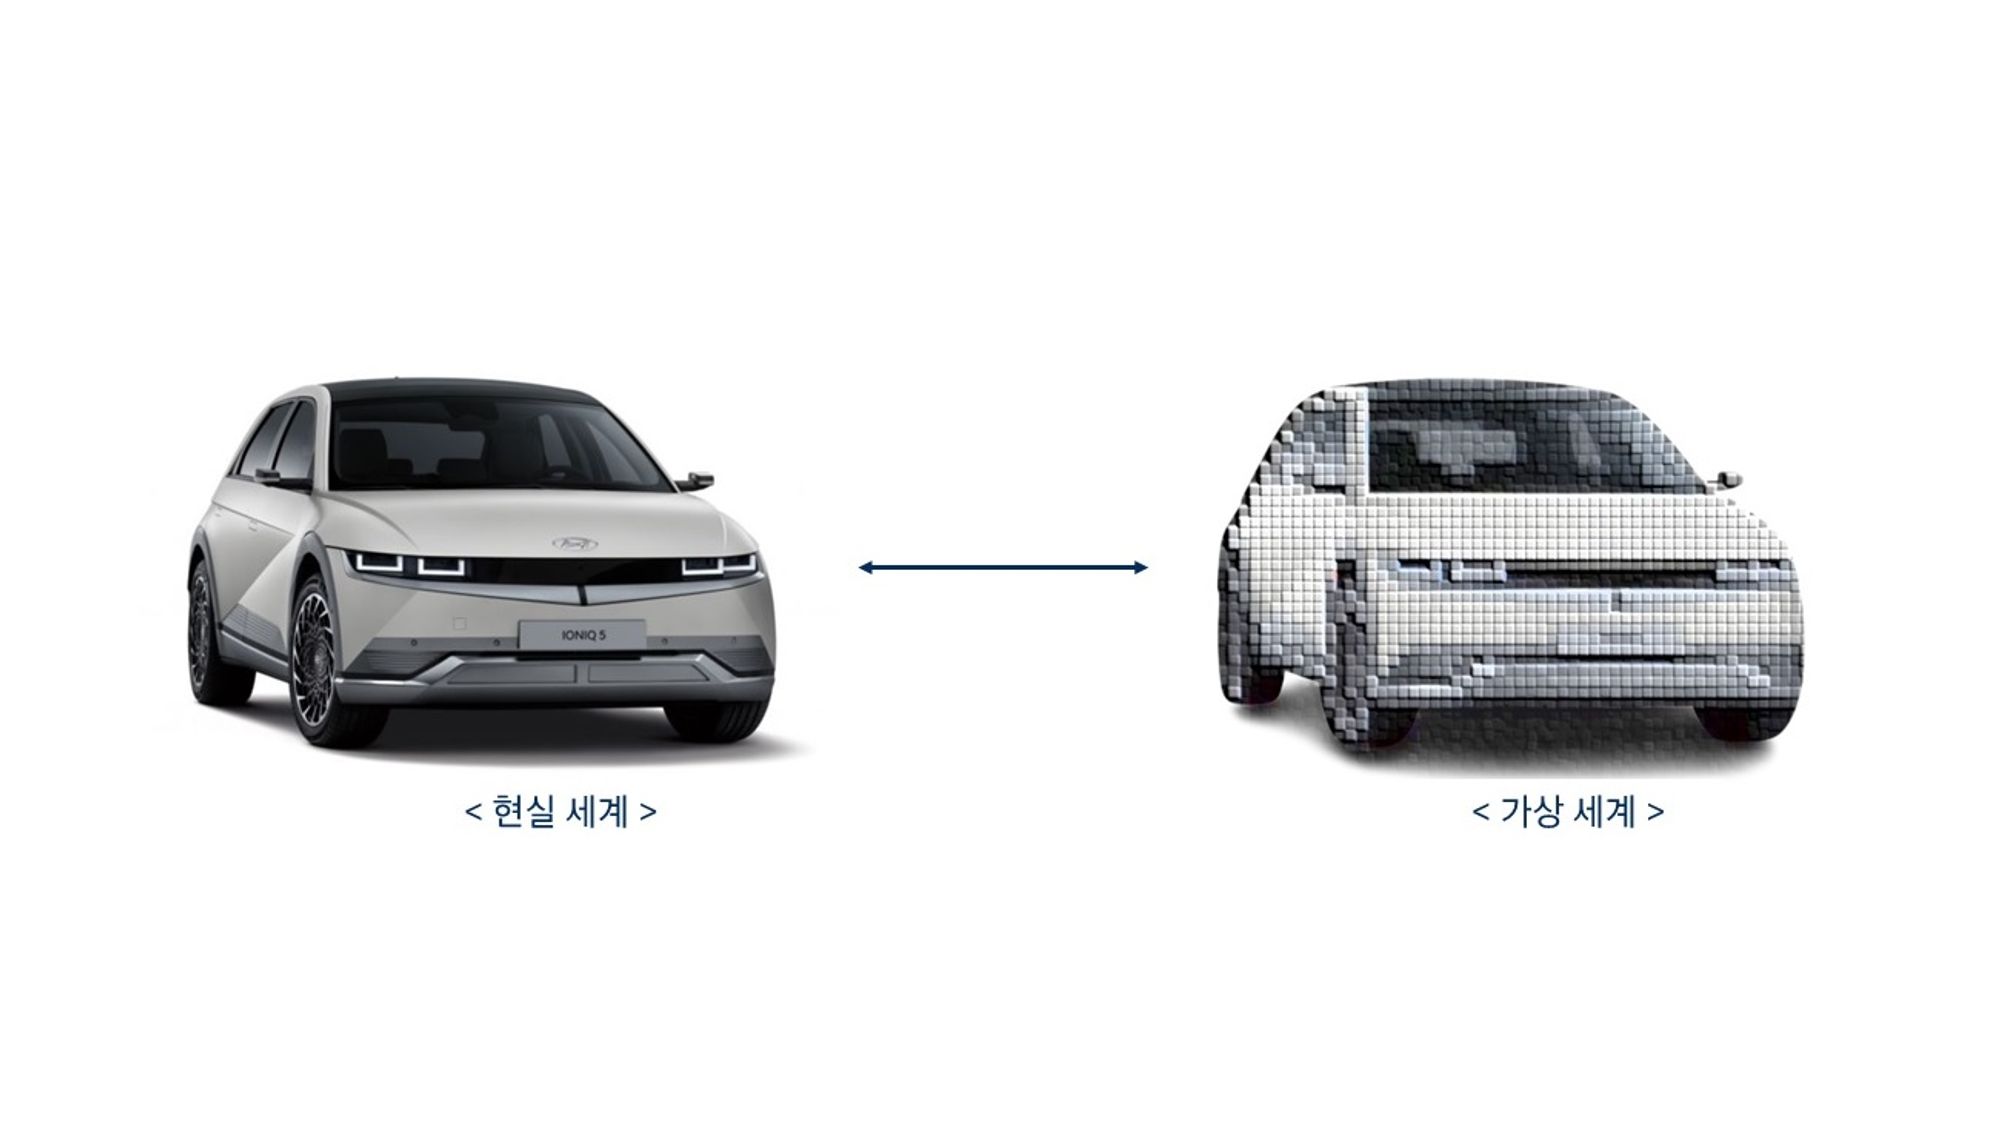
The second case of big data utilization involves Hyundai Motor’s prediction of electric vehicle battery performance through data. Last year, Hyundai Motor Group announced that it had used MS Azure to complete the ‘Electric Vehicle Battery Performance Prediction PoC’ In particular, “Azure Databricks” was utilized to process and analyze large amounts of driving data used to automate pre-processing and model learning, and to improve work efficiency through ease of project maintenance.
An official described it as “an example of introducing a public cloud service into digital twin construction to manage the core assets and batteries of electric vehicles,” and explained, “We will devise an automobile data pipeline in the future to improve model prediction accuracy and continue to verify operational efficiency.”
Hyundai Motor’s DX Training Case Study - Watch now
What is the process of data analysis?
We’ve learned about the importance of data, what data analysis is, and the need for it. So what does the actual data analysis process look like? Let’s find out more about the process of data analysis.
Step 1 of the Data Analysis process: Setting goals for data utilization
The first step in data analysis is to clearly understand why you are using the data for analysis. To extract and analyze the right data, it’s essential to have a clear goal for data utilization, knowing what results you want to achieve, what problems you want to solve, and what the ultimate objectives are. You will need a clear data utilization goal to extract and analyze the right data. Goal setting requires an understanding of the collected data.
Step 2 of the Data Analysis Process: Collect raw data
Once a clear goal has been set, the next process of data analysis is to collect all the raw data needed to achieve the goal. To do this, it is important to clarify what data you need to collect. You also need to make sure you collect the data appropriate to the area in which it’ll be handled. For example, you can collect the following data.
- Purchasing rates, purchase records, etc. of products that need to be analyzed
- Customer reviews and feedback
- User Interview Results
- Customer conversion rate
- Email Open Rate
- Click Rate
- Number of exposures
Step 3 of the Data Analysis Process: Data Cleanup
The third process of data analysis is to organize and structure all the raw data you have collected. It’s crucial to go through a cleaning process, which includes checking for missing data, correcting errors in raw data collected from various sources, removing duplicate data, and fixing inconsistent formats or eliminating unnecessary data.
Step 4 of the Data Analysis Process: Data Analysis
Once you’ve selected the data you need to utilize, the fourth step of data analysis is to analyze the data according to the goals you set in step 1.
- Summarize collected data: To understand the trends in the organized data, divide and summarize the data according to different perspectives, such as cause and effect
- Identify problematic situations and find patterns in the data: diagnosing why certain results occurred.
- Data Pattern-Based Predictions: Predicting and hypothesizing about recurring patterns that lend to situations in which A → B
- Prepare and plan for the predicted situation: Consider with the data what solutions you will apply to predicted situations.
Step 5 of the Data Analysis Process: Visualization of Results
The final process is to organize and interpret the results of the data analysis and visualize them as reports, graphs, dashboards, etc. Organizing the analysis provides clear insights on whether you have in fact produced the desired results, and what actions you will need to take from now on. This result is what influences an organization’s decision-making and future direction.
So far, we have explored the importance of data, what data analysis is, its necessity, and examples of utilizing big data. Furthermore, we’ve also summarized the process of how to put data analysis into practice.
Data is becoming more important day by day. The data era is an inevitable trend, and to survive in this era, enterprise data strategies and digital transformation are essential. If you’re dreaming of cutting-edge data utilization and effective digital transformation, work with Elice, an education platform specializing in digital transformation, and become your own case of effective big data utilization.
Elice offers field training for data analysis that will increase data analytics capabilities and work productivity. In particular, Elice data analysis training helps non-IT executives and employees develop solutions with their own data. Take your first step in data analysis with Elice, a professional DX training platform!
The One-Stop DX Solution for Data Training and Evaluation, Elice - View Now
*This content is a copyrighted work protected by copyright law and is copyrighted by Elice.
*The content is prohibited from secondary processing and commercial use without prior consent.
- #DX
- #Data