
What are the no-code data visualization tools for non-technical people?
Elice
12/14/2023
In today’s business landscape, data-driven decision-making has transitioned from a strategic choice to an essential practice. As the requirement for data analysis in business operations escalates, the demand for data experts has surged. Yet, the imperative to leverage data extends beyond the realm of specialists. Practitioners without expert-level data skills increasingly encounter the need to engage in data visualization. This discussion aims to demystify data visualization, highlighting its critical role in informed decision-making. We will also introduce Tableau, a user-friendly, no-code tool for data visualization, and Google Data Studio, both accessible for those with varying levels of expertise.
What is data visualization?

Data visualization refers to presenting data using visual elements such as charts, maps, and graphs, making it easier to comprehend complex numerical information. Visualization tools play a role in improving and automating the visualization process for accuracy. In the business context, these tools enable organizations to extract insights more conveniently from automatically generated data materials, contributing to data-driven decision-making.
Data Analysis Process
For reference, the data analysis process for data-driven decision-making is as follows:
1) Set Data Objectives:
Establish the reasons for conducting data analysis. Summarize requirements that will assist in decision-making, such as defining the analysis objectives and determining the types of data needed.
2) Collect Raw Data:
Collect data according to the established requirements. Choose an appropriate system to collect data in a way that is not cumbersome when collecting, managing, and utilizing data.
3) Clean Data:
Refine the collected data by removing irrelevant, duplicate, or erroneous data. Filtering out unnecessary data is crucial to increasing the accuracy of the analysis results.
4) Analyze and Interpret Data:
After processing data collection and cleansing, proceed with data analysis. Utilize data analysis tools to comprehend and interpret requirements, extracting relevant insights.
5) Visualize Results Data:
Visualize the data set effectively for easy verification. Typically presented in charts and graphs, making it easy to grasp. Data visualization allows for the discovery of previously unnoticed facts, patterns, relationships, trends, and more.
If you want to learn more about the detailed data analysis process, check it out now.
Reasons for the Necessity of Data Visualization
So, why is data visualization essential for businesses? Data visualization aids in streamlining decision-making within the company by presenting visualized data at a glance and enabling more effective utilization of data in practical scenarios. In other words, it plays a role in facilitating smooth data-centric decision-making when improving businesses and formulating strategies.
Companies accumulate vast amounts of data. Typically, the data collected, both internally and externally, is in the form of raw data that is challenging to utilize directly in practical settings. This is why the process of data visualization is necessary. Therefore, data scientists use data visualization tools to identify relationships, patterns, and trends among data and perform data visualization tasks to allow decision-makers to use data in the appropriate context.
Advantages of Data Visualization
Through data visualization, top executives and key stakeholders can interpret data more meaningfully. It enables quicker data analysis and the ability to paint a broader picture, thereby increasing operational efficiency. Particularly, it helps identify nuances in customer service, confirm patterns and trends, extract valid insights, and enhance a company’s competitiveness. Lastly, with data visualization technology, data can be utilized and shared among various teams. By collectively examining the data, teams can develop common goals and plans, allowing data-driven decision-making across the entire organization.
Challenges in Data Visualization
However, even seemingly favorable data visualizations require caution, as the information can be misrepresented or exaggerated. Companies that utilize data visualization for decision-making must be mindful of the following issues throughout the entire decision-making process.
Excessive Data Simplification
Simplifying data excessively can result in the loss of crucial information. Various factors can influence the outcome of certain results. If data is overly simplified in the visualization process, these factors may be overlooked. Therefore, data scientists need to strike a balance when visualizing data.Biased Outcome Presentation
If the author of a data report has biases, it can impact data visualization. Personal biases may lead to discerning data that aligns with specific organizational or personal agendas, resulting in biased outcomes. Even when using data visualization tools, if the team operating them has biases, the process of selecting and organizing data may lead to biased results. Hence, it is crucial to incorporate diverse perspectives during data visualization to avoid biased outcomes.Data Exaggeration
Raw data, being raw and unprocessed, can potentially create nonexistent correlations during the interpretation process. Inaccurately derived data visualizations can unjustifiably validate incorrect decision-making, hindering business growth.
Components of Data Visualization

There are three main components for data visualization essential for informed decision-making.
Story
The purpose of data visualization, namely the story, refers to the collaborative discussion between data scientists and business users about the goals to be achieved through data analysis. Whether predicting sales or measuring key performance indicators, data scientists and business users collaborate to construct the story that needs to be conveyed through data.
Data
Data analysts identify an appropriate dataset to explain the data story. They modify data formats, eliminate errors, clean up the data, and perform additional analyses. Once the data is prepared, they plan various visual exploration methods.
Visual Elements
Finally, data scientists choose the most suitable data visualization method when sharing insights. They emphasize key data points and simplify complex datasets. Additionally, they contemplate how to systematically present data to the business.
With these elements in place, the data visualization process is implemented through the steps of ‘goal definition - data collection - data cleaning - selection of visual materials - creation of visual materials.’
Introduction to No-Code Data Visualization Tools
So far, we’ve explored concepts and methods related to data analysis and data visualization. Now that you understand the importance of data visualization in corporate decision-making, it’s time to use data visualization tools to visually represent data. Below are two no-code data visualization tools designed to help non-experts in the field visualize data easily. Check out the features of each tool and try visualizing your desired data effortlessly.
Tableau
While many consider data visualization to be the realm of experts, there are no-code data visualization tools designed to make it easy even for non-professionals. One such tool is Tableau. Tableau is a no-code Business Intelligence (BI) solution widely used in various fields with the goal of utilizing data. It stands out for its high freedom of data visualization compared to other solutions, allowing users to freely utilize various functions. However, due to its diverse functionality, there is a certain learning curve. Tableau employs a subscription-based licensing policy based on user types and purposes of use. It offers a free version up to a certain level, and for paid licenses, the pricing varies from 15 to 70 dollars per month, depending on the features supported. Therefore, you can choose a pricing plan according to your business requirements. If you are looking to study a no-code BI solution, the free license is often sufficient for your needs.
Google Data Studio
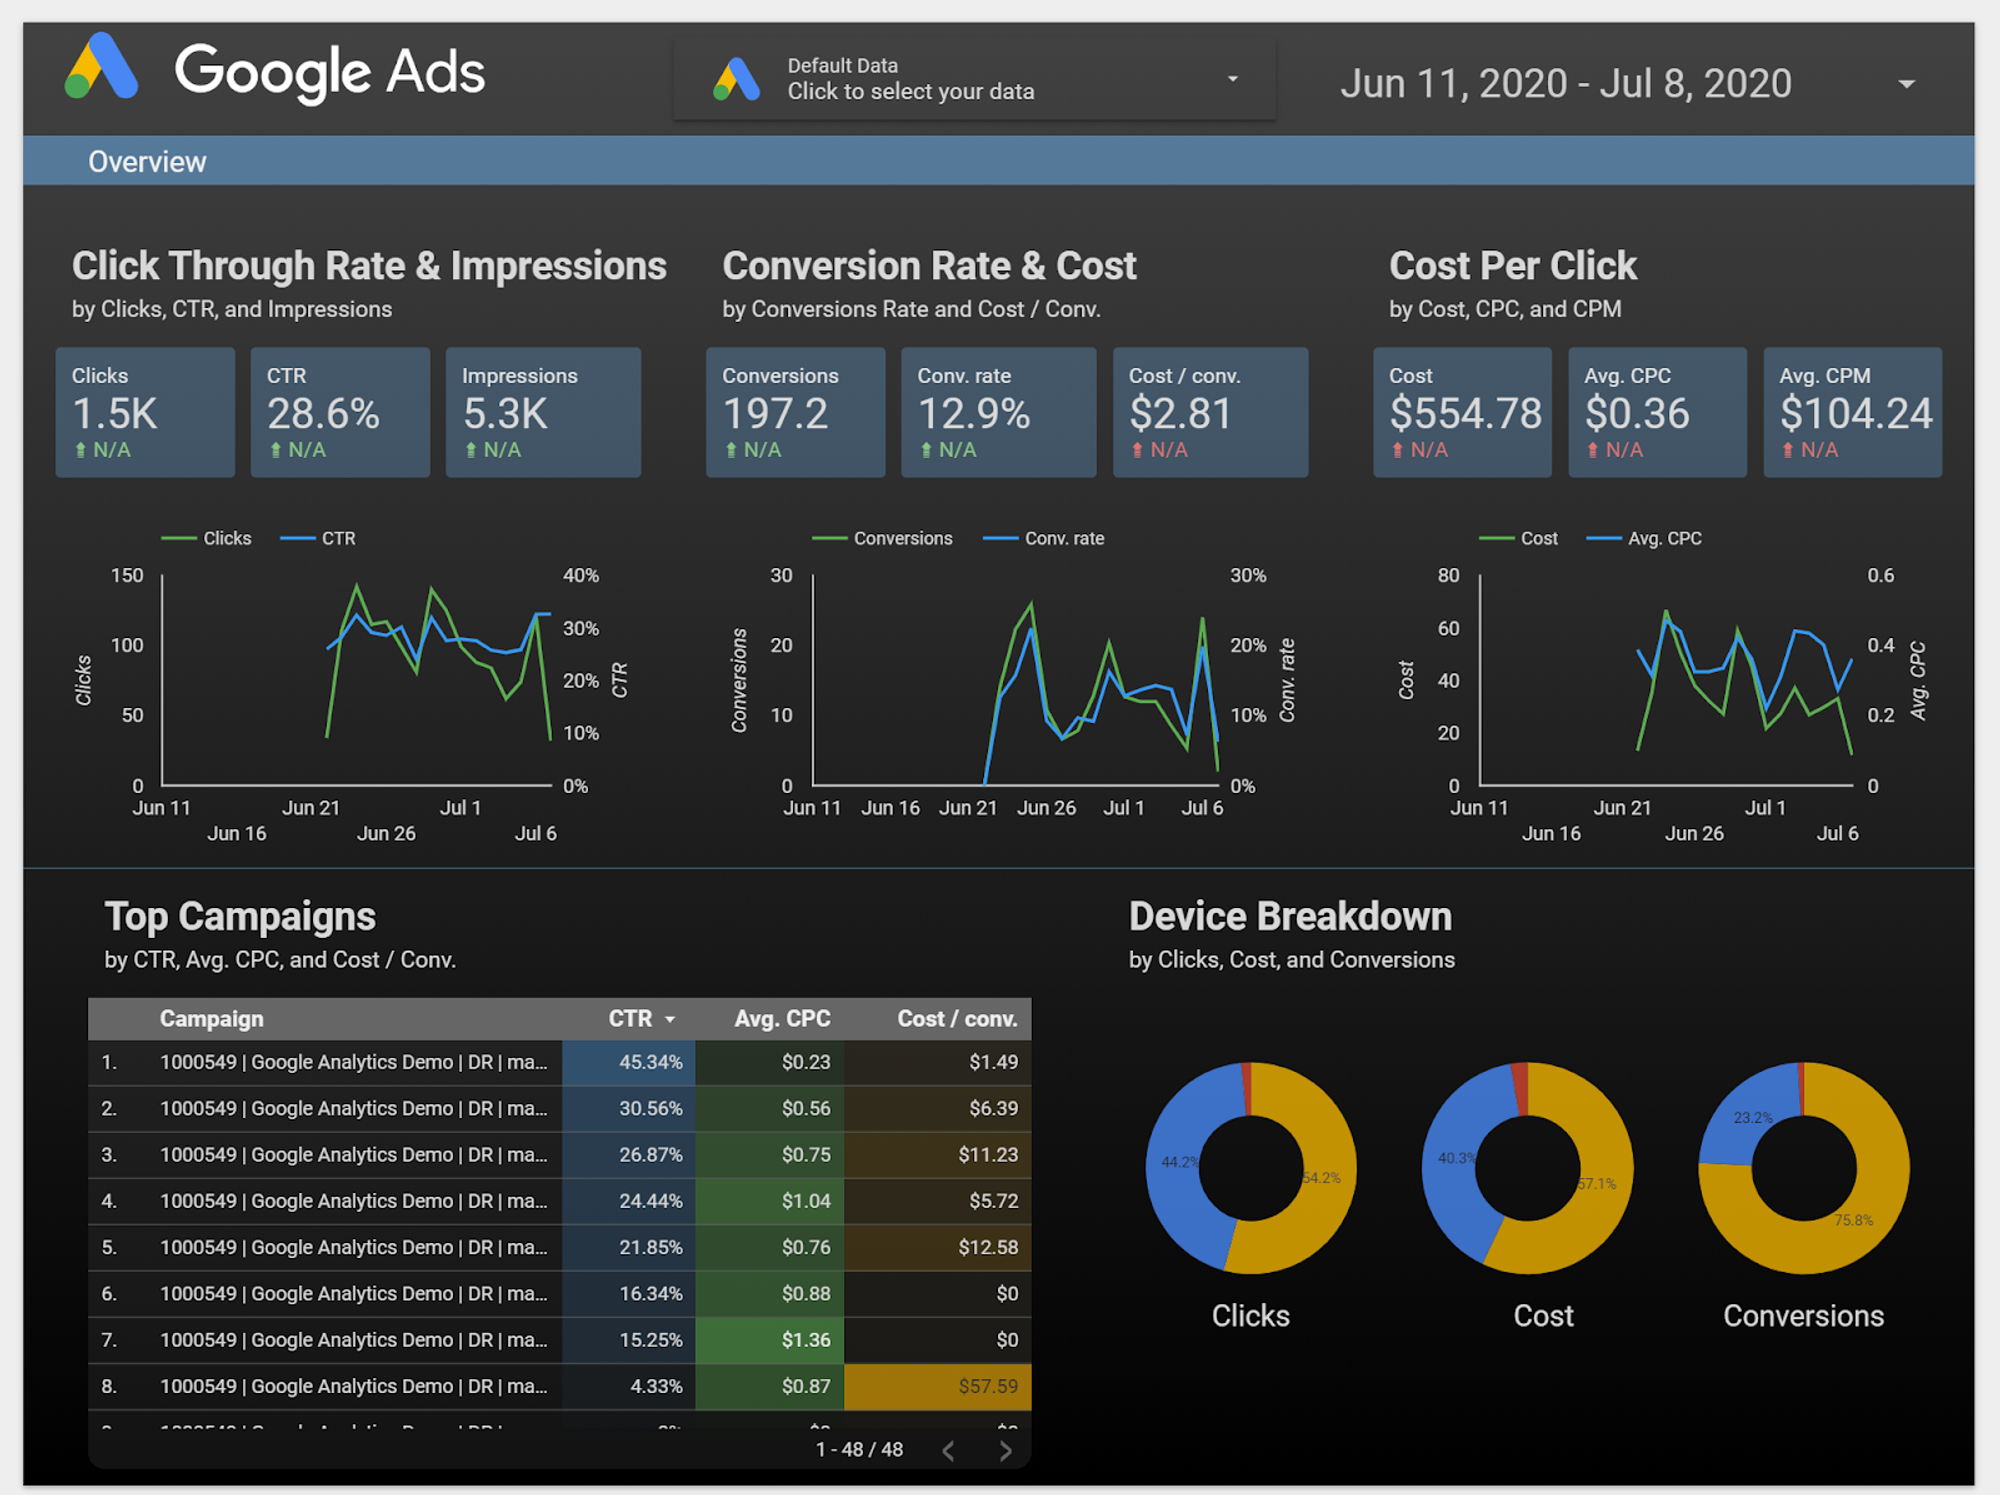
Google Data Studio is a relatively low-entry data visualization tool, providing an easy-to-use user interface that allows even beginners, not just experts, to learn easily. Google Data Studio allows unlimited dashboard creation for free users and provides various templates to use. Especially when used in conjunction with Google Analytics (GA), Google Data Studio can create powerful synergy. By linking GA and Google Data Studio and utilizing various dashboard templates, customized data visualization becomes possible. Additionally, Google Data Studio is convenient for sharing data with others.
This article has delved into the essence and advantages of data visualization in the context of data-driven decision-making, alongside an introduction to two accessible, no-code data visualization platforms: Tableau and Google Data Studio. As the global focus on data intensifies, beginning to navigate the vast domain of data studies can appear daunting. Elice steps in with a comprehensive data visualization course centered on Tableau, a no-code tool. The course offers practical, straightforward tutorials. For those keen on gaining firsthand experience with no-code data visualization through Tableau, embarking on this journey with Elice could be an excellent starting point.
Corporate Training Program for Data Visualization - Contact Us Now
No-Code Data Visualization Course Using Tableau - Check It Out Now
*This content is a copyrighted work protected by copyright law and is copyrighted by Elice.
*This content does not allow any secondary modifications or commercial utilization without prior consent.
- #DX
- #Data